Q1. Is atSNP Search exclusively for human?
- A1. Our current release only has data from the human genome. We plan to extend the database to mouse in the near future.
Q2. Which dbSNP version was used for atSNP Search?
- A2. atSNP Search is based on dbSNP build 144 for Human Build 38 GRCh38/hg38. Summary on the dbSNP build 144 can be found here.
Q3. How does atSNP Search handle SNPs with indels, and others?
- A3. dbSNP classifies genetic variation into eight types. Click here for the types of variation. The current atSNP Search only considers the major single nucleotide variation class. This class constitutes 88.8% of all genetic variation, specifically 132,946,852 SNPs out of 149,735,377.
Q4. How are multi-allelic SNPs evaluated?
- A4. atSNP Search considers all possible alleles one at a time and provides atSNP statistics and p-values.
Q5. Which motif libraries were used for atSNP?
- A5. We used the JASPAR vertebrate library and known and discovered motifs for the ENCODE TF ChIP-seq datasets, which are available here for JASPAR, and here for ENCODE, respectively. For users who want to learn more about the libraries, visit the websites or click here.
Q6. Can I have summary statistics of atSNP Search?
- A6. We investigated 132,946,852 SNPs and considered 2,270 PWMs. We have evaluated total 307,602,574,340 SNP-PWM combinations.
Currently, 37,141,563,102 (SNP, PWM) combinations with p-value SNP impact, p-value reference, and/or p-value SNP less than or equal to
0.05 are currently available to query.
Q7. Are downloads available?
- A7. The current release allows users to download results in CSV format from queries that return 5,000 results or less.
Q8. How can I interpret the logo plots?
- A8. The plots are called composite logo plots and they aim to provide a quick visualization of the region around the SNP and the sequence matches to the PWM.
Please click here for the interpretation.
Q9. Why can't I page past 10,000 search results?
-
A9. If more than 10,000 results are returned, due to limits on computing resources,
only the first 10,000 will be avaiable to page through.
To access results past the 10,000th, adjust the sort order and/or priority.
Q10. How do I cite atSNP Search?
- A10.
-
1. Zuo, Chandler, Shin, Sunyoung, and Keleş, Sündüz. atSNP: transcription factor binding affinity testing for regulatory SNP detection. Bioinformatics (2015): 31, 3353-3355.
-
2. Shin, Sunyoung, Hudson, Rebecca, Harrison, Christopher, Craven, Mark, and Keleş, Sündüz. atSNP Search: a web resource for quantifying impact of dbSNP SNPs on transcription factor binding. (2018). In preparation.
Q11. What web browsers are supported by atSNP?
- A11. Everything except Internet Explorer (newest versions are called 'Edge').
Q12. What is a non-technical interpretation of the three p-values?
- A12-1. P-value SNP Impact: A significant p-value SNP Impact indicates that the SNP is candidate for potential gain- or loss-of -function.
- A12-2. P-value Reference: A significant p-value Reference indicates a candidate binding site at the SNP location with the reference allele.
- A12-3. P-value SNP: A significant p-value SNP indicates a candidate binding site at the SNP location with the SNP allele.
Q13. How does atSNP Search define gain-of-function?
Q14. How does atSNP Search define loss-of-function?
Q15. How are motifs (PWMs) classified into low, moderate, high, and very high degeneracy groups?
- A15.
This is based on computing information content (IC) of each individual position within the PWM and then taking the median of the information content across all positions. These median IC values are then percentiled (25%, 50%, and 75%) to classify each PWM into the following four classes.
-
| Median Information Content |
Motif Degeneracy Label |
| [0, 0.70) | Very High |
| [0.7, 1.1) | High |
| [1.1, 1.52) | Moderate |
| [1.52, 2] | Low |
-
Low information content indicates a very degenerate motif.
While this does not have implications in terms of actual functionality,
when possible, following up less degenerate motifs is more preferable.
Q16. What is a good use for atSNP Search sort order?
Q17. I would like to evaluate some SNPs that are not in atSNP Search. Any suggestions?
-
A17. We suggest using the atSNP R package. The R package has both the JASPAR and ENCODE motif libraries that you can evaluate your SNPs against.
Q18. I would like to evaluate my SNPs against PWMs that are not part of JASPAR or ENCODE. Any suggestions?
-
A18. We suggest using the atSNP R package, which allows user defined PWMs.
Q19. I am working on data from Diversity Outbred (DO) mouse. Can I use atSNP Search?
-
A19. The current release of atSNP Search only has human data. We suggest using the atSNP R package for evaluating your DO SNPs.
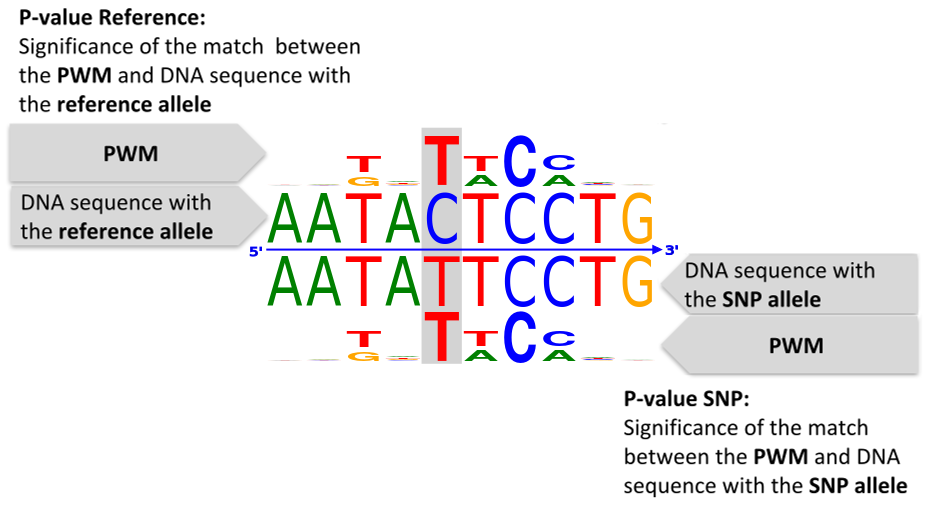
Q20. How do the search results' values for P-value Reference and P-value SNP relate
to each result's composite logo plot?
-
A20. See the following figure:
Q21. What p-value cutoffs does atSNP Search use if I don’t specify gain or loss of function?
-
A21. atSNP Search by default returns records with p-values indicating that they are candidates
for gain of function or loss of function.
- (i) P-value SNP Impact ≤ 0.05 and p-value Reference ≤ 0.05 and p-value SNP > 0.05,
candidates for loss of function.
-
(ii) P-value SNP Impact ≤ 0.05 and p-value Reference > 0.05 and p-value SNP ≤ 0.05,
candidates for gain of function.