atSNP Search Help
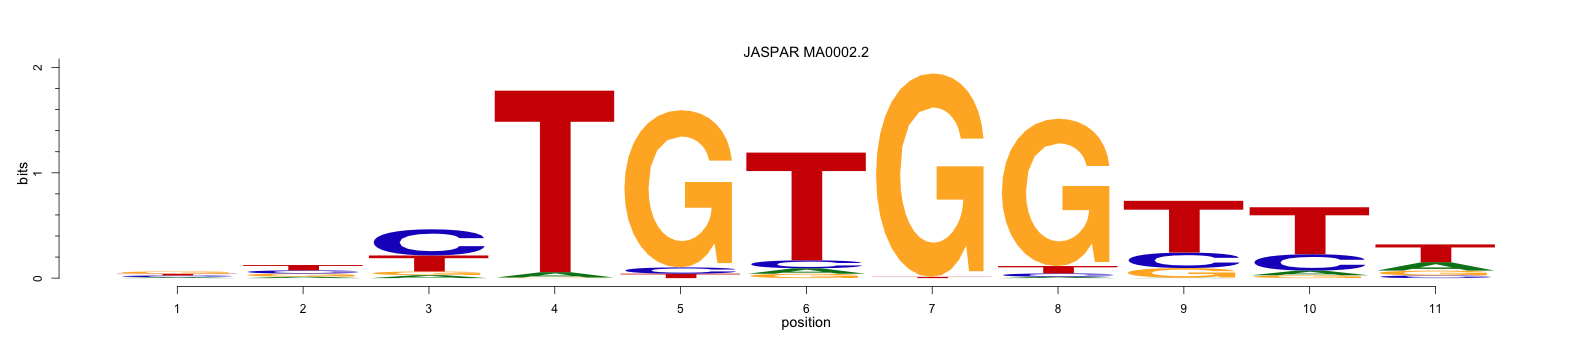
Motif libraries provide nucleotide patterns that transcription factors recognize well from a set of transcription factor binding sites. The binding profiles are represented with position weight matrices (PWMs). PWMs are used for probabilistic description of the patterns in genomic sequences. The PWM is visualized as a sequence logo, where letter heights are scaled based on their information content.
- JASPAR 2014 Core Vertebrata
- ENCODE Library
- Mathelier, A., Zhao, X., Zhang, A. W., Parcy, F., Worsley-Hunt, R., Arenillas, D. J., Buchman, S., Chen, C.-y., Chou, A., Ienasescu, H., Lim, J., Shyr, C., Tan, G., Zhou, M., Lenhard, B., Sandelin, A. and Wasserman, W. W. “JASPAR 2014: an extensively expanded and updated open-access database of transcription factor binding profiles.” Nucleic Acids Research, 2013
- Kheradpour, Pouya, and Manolis Kellis. "Systematic discovery and characterization of regulatory motifs in ENCODE TF binding experiments." Nucleic Acids Research 42.5 (2014): 2976-2987.
- Matys,V., Fricke,E., Geffers,R., Gossling,E., Haubrock,M., Hehl,R., Hornischer,K., Karas,D., Kel,A.E., Kel-Margoulis,O.V. et al. (2003) TRANSFAC(R): transcriptional regulation, from patterns to profiles. Nucleic Acids Res., 31, 374–378.
- Sandelin,A., Alkema,W., Engstrm,P., Wasserman,W.W. and Lenhard,B. (2004) JASPAR: an open-access database for eukaryotic transcription factor binding profiles. Nucleic Acids Res., 32, D91–D94.
- Berger,M.F., Philippakis,A.A., Qureshi,A.M., He,F.S., Estep,P.W. and Bulyk,M.L. (2006) Compact, universal DNA microarrays to comprehensively determine transcription-factor binding site specificities. Nat. Biotechnol., 24, 1429–1435.
- Badis,G., Berger,M.F., Philippakis,A.A., Talukder,S., Gehrke,A.R., Jaeger,S.A., Chan,E.T., Metzler,G., Vedenko,A., Chen,X. et al. (2009) Diversity and complexity in DNA recognition by transcription factors. Science, 324, 1720–1723.
- Berger,M.F., Badis,G., Gehrke,A.R., Talukder,S., Philippakis,A.A., Pea-Castillo,L., Alleyne,T.M., Mnaimneh,S., Botvinnik,O.B., Chan,E.T. et al. (2008) Variation in homeodomain DNA binding revealed by high-resolution analysis of sequence preferences. Cell, 133, 1266–1276.
- Jolma,A., Yan,J., Whitington,T., Toivonen,J., Nitta,K.R., Rastas,P., Morgunova,E., Enge,M., Taipale,M., Wei,G. et al. (2013) DNA-binding specificities of human transcription factors. Cell, 152, 327–339.
- Hughes,J.D., Estep,P.W., Tavazoie,S. and Church,G.M. (2000) Computational identification of Cis-regulatory elements associated with groups of functionally related genes in Saccharomyces cerevisiae. J. Mol. Biol., 296, 1205–1214.
- Liu,X.S., Brutlag,D.L. and Liu,J.S. (2002) An algorithm for finding protein-DNA binding sites with applications to chromatinimmunoprecipitation microarray experiments. Nat. Biotechnol., 20, 835–839.
- Bailey,T.L. and Elkan,C. (1994) Fitting a mixture model by expectation maximization to discover motifs in biopolymers. Proc. Int. Conf. Int. Syst. Mol. Biol., 2, 28–36.
- Pavesi,G., Mauri,G. and Pesole,G. (2001) An algorithm for finding signals of unknown length in DNA sequences. Bioinformatics, 17, S207–S214.
- Ettwiller,L., Paten,B., Ramialison,M., Birney,E. and Wittbrodt,J. (2007) Trawler: de novo regulatory motif discovery pipeline for chromatin immunoprecipitation. Nat. Methods, 4, 563–565.
JASPAR is the largest open-access database of matrix-based nucleotide profiles describing the binding preferences of transcription factors from multiple species (Mathelier et al., 2013). JASPAR 2014 Core Vertebrata provides position frequency matrices for 205 non-redundant profiles and their summaries. The position frequency matrix is converted into the position weight matrix, which carries the same information.
Example
The JASPAR library contains a position frequency matrix for a transcription factor RUNX1 and its sequence logo as below. Its summary is presented here.
A
C
G
T
287 234 123 57
0 87 0 17
10 131 500
496 485 1072 0
75 127 0 42
400 463 158
696 467 149 7
1872 70 1987 1848
251 81 289
521 814 656 1936
53 1716 13 93
1339 1325 1053
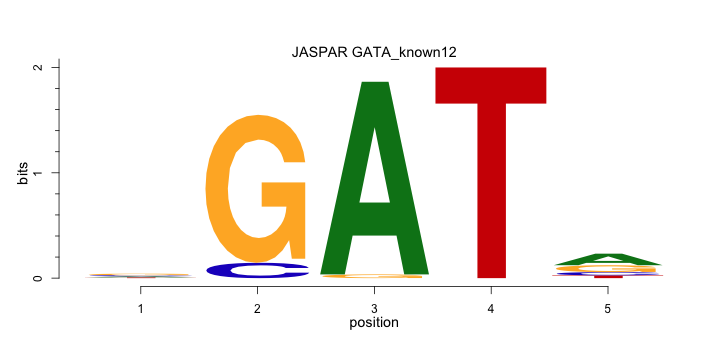
The ENCODE library features systematic discovery and characterization of regulatory motifs in transcription factor binding experiments (Kheradpour et al., 2014). These PWMs are available here. This collection contains known motifs from the literature (TRANSFAC, JASPAR Homo Sapiens, and UniPROBE), in addition to the de novo motifs from hundreds of transcription factor binding experiments performed by ENCODE. These motifs were discovered using established tools such as MDscan , MEME, Trawler, and AlignACE . All known and discovered motifs are grouped as in the table here. For known ENCODE motifs, the naming convention indicates the source which initially reported the motif. For de novo motifs, the names contain information about the experiments that were used to discover the motif. This information includes the name of the lab and the names of any motif discovery tools used.
Example
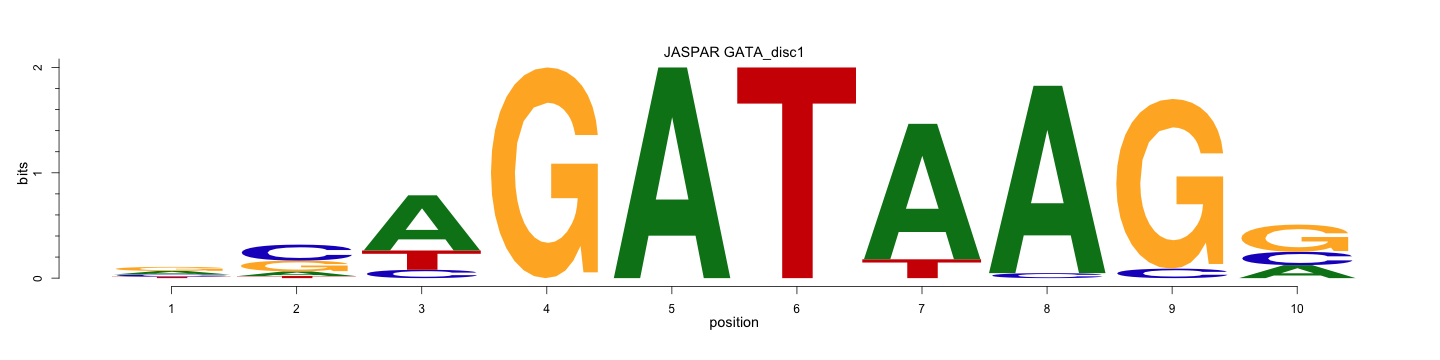
The ENCODE library provides 22 known motifs and 6 discovered motifs for transcription factor GATA, which are available here. Here, we present one known GATA motif (GATA_known12) and one discovered GATA motif (GATA_disc1). GATA_known12 is from JASPAR Homo Sapiens and GATA_disc1 is obtained from ENCODE Snyder Lab GATA1 ChiP-seq TF experiments with the MDscan tool.
A
C
G
T
0.245 0.000 0.981 0.000 0.472
0.245 0.094 0.000 0.000 0.132
0.340 0.906 0.019 0.000 0.283
0.170 0.000 0.000 1.000 0.113
A C G T
0.323 0.138 0.667 0.000 1.000
0.000 0.878 0.974 0.000 0.243
0.185 0.476 0.101 0.000 0.000
0.000 0.000 0.026 0.053 0.249
0.360 0.323 0.000 1.000 0.000
0.000 0.000 0.000 0.947 0.508
0.132 0.063 0.233 0.000 0.000
1.000 0.122 0.000 0.000 0.000
References
OVERVIEW AND PROCEDURE
OVERVIEW
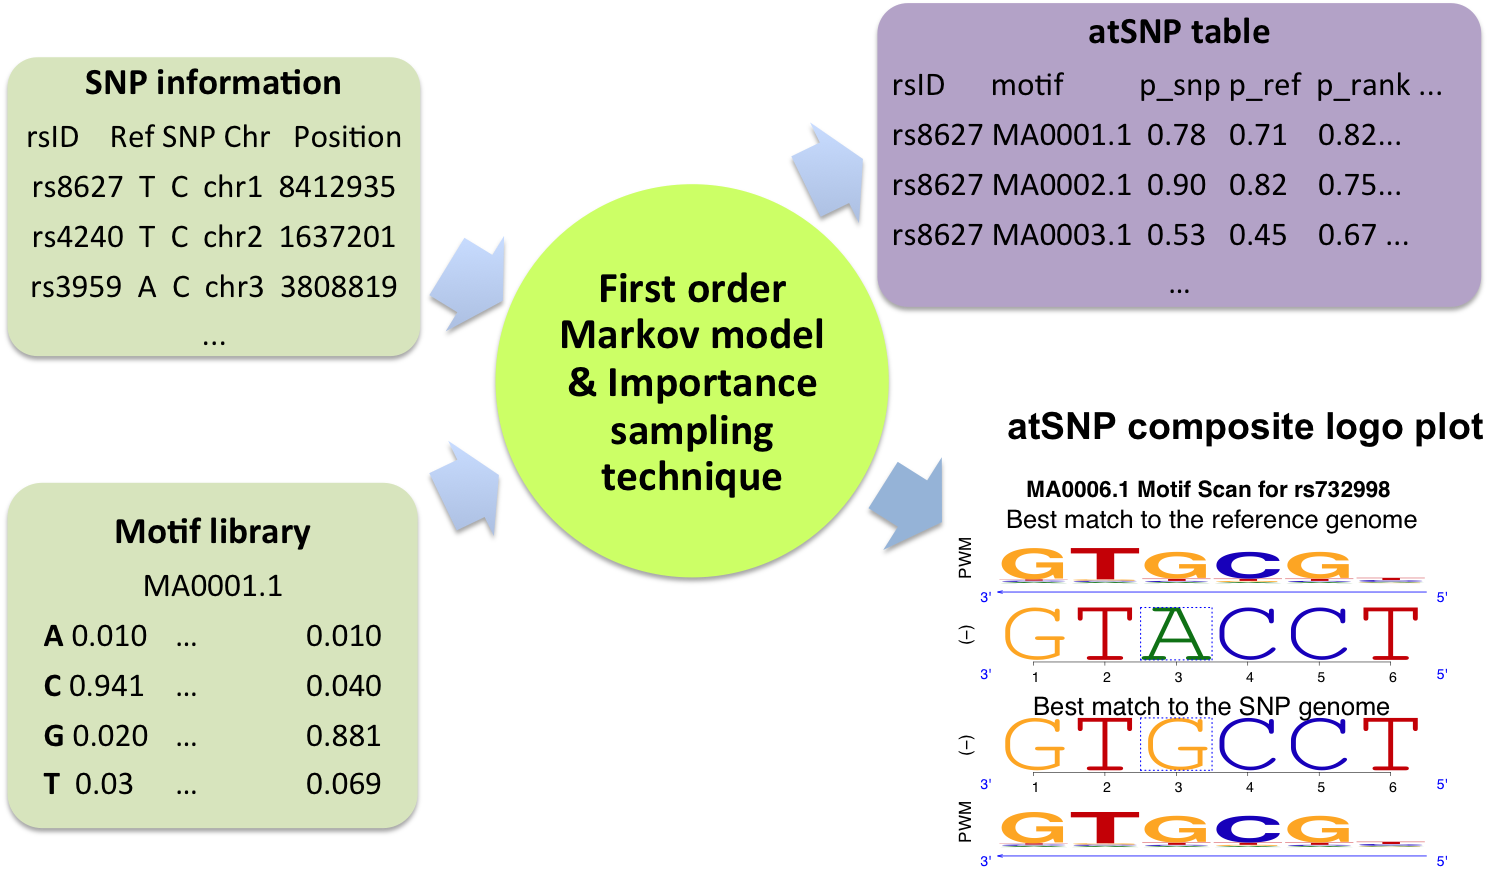
atSNP takes as input SNP information/genomic subsequences and a PWM for a transcription factor. atSNP uses a first order Markov model and an importance sampling technique to test the statistical significance of the best match between the PWM and the subsequences overlapping the SNP position with both the reference and the SNP alleles. More imporantly, it further tests the impact of SNPs on the matches to the PWM. The testing results are summarized with a table and a graphical output named composite logo plot. To learn more about the outputs, visit "Interpreting search output” and “Reading composite logo plot”.
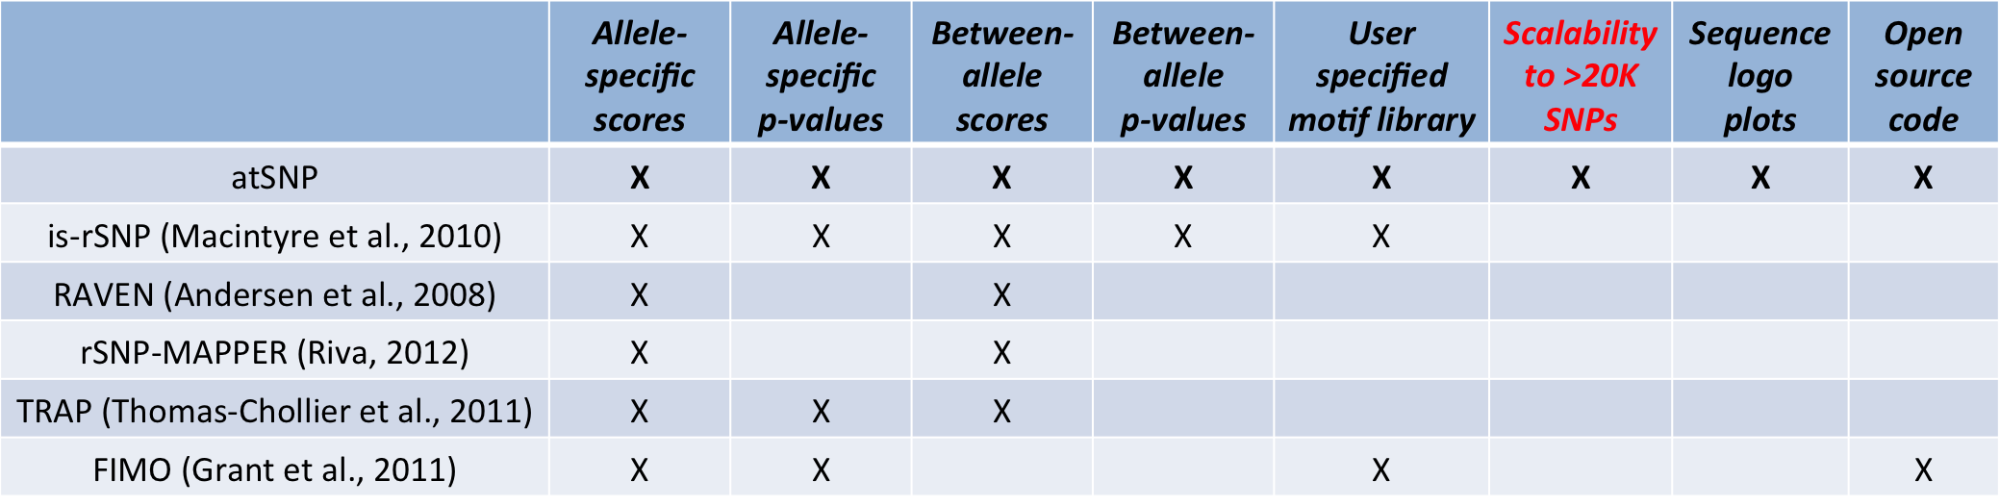
Table 1 provides a comparison of functionality between atSNP's statistical method and alternative methods. atSNP provides the most comprehensive information on identifying the impact of SNPs on transcription factor binding. Only atSNP and is-rSNP provide statistical quantification of the impact of SNPs on the binding. Furthermore, atSNP addresses the scalability issue with an efficient computation enabled by an importance sampling technique. atSNP visualizes the best matches with both the reference and the SNP alleles and the change in those matches created by the SNP. atSNP Search results are obtained from the R package atSNP, that implements this procedure.
PROCEDURE
- Step 1: affinity score
- Step 2: p-value for the affinity score
- Step 3: p-value for the affinity change between alleles
- Zuo, Chandler, Shin, Sunyoung, and Keleş, Sündüz. atSNP: transcription factor binding affinity testing for regulatory SNP detection. Bioinformatics (2015): 31, 3353-3355
- Andersen, Malin C., Engstrom, Par G., Lithwick, Stuart, Arenillas, David, Eriksson, Per, Lenhard, Boris, Wasserman, Wyeth W., and Odeberga, Jacob. In silico detection of sequence variations modifying transcriptional regulation. PLoS Computational Biology 4.1 (2008): e5.
- Grant, Charles E., Timothy L. Bailey, and William Stafford Noble. FIMO: scanning for occurrences of a given motif. Bioinformatics 27.7 (2011): 1017-1018.
- Macintyre, Geoff, Bailey, James, Haviv, Izhak, and Kowalczyk, Adam. is-rSNP: a novel technique for in silico regulatory SNP detection. Bioinformatics 26.18 (2010): i524-i530.
- Riva, Alberto. Large-scale computational identification of regulatory SNPs with rSNP-MAPPER. BMC genomics 13.4 (2012): S7.
- Thomas-Chollier, Morgane, Hufton, Andrew, Heinig, Matthias, O'keeffe, Sean, Masri, Nassim E., Roider, Helge G., Manke, Thomas, and Vingron, Martin. Transcription factor binding predictions using TRAP for the analysis of ChIP-seq data and regulatory SNPs. Nature protocols 6.12 (2011): 1860-1869.
Using a PWM as a set of parameters for a product multinomial model, atSNP computes log likelihoods for all subsequences overlapping the SNP location that have the same length as the motif. The best matches are those with the largest log likelihood with both the SNP and reference alleles. The scores of the best matches are used for statistical testing.
Example
We evaluate impact of a SNP, rs117959046, on the binding of the transcription factor GATA2, with GATA_known12 motif:
|
|
The motif length is 5 and sequences of length 9 centered at the SNP position are extracted from both the reference allele and the SNP variation of the reference allele:
| Reference allele: | AAGACAAGC |
| SNP allele: | AAGATAAGC |
Next, we compute log likelihoods of all subsequences of length 5 spanning the SNP position and find the best match, which is associated with the largest log likelihood. The second subsequence on the forward strand (AAGACACG) has the largest log likelihood with the reference allele. (Table 2). The second subsequence on the forward strand also has the largest log likelihood with the SNP allele (Table 3).
Reference Allele
Forward strand score
Reverse strand score AAGACAAGC -53.45 -49.31 AAGACAAGC -25.30 -50.10 AAGACAAGC -70.91 -30.79 AAGACAAGC -28.08 -72.66 AAGACAAGC -49.50 -27.73
SNP Allele
Forward strand score
Reverse strand score
AAGATAAGC -53.60 -49.64
AAGATAAGC -2.28 -73.03
AAGATAAGC -70.91 -26.84
AAGATAAGC -48.74 -72.66
AAGATAAGC -49.87 -27.22
The p-value for the affinity score with the reference allele (p-value Reference) is the probability that a random sequence has an affinity score larger than or equal to the best match score with the reference allele. atSNP simulates random sequences using a first order Markov model. It estimates the p-value as the frequency of randomly getting as large or larger affinity scores than the best match score with the reference allele. Similarly, the p-value for the affinity score with the SNP allele (p-value SNP) is estimated as the frequency of getting random scores as large or larger than the best match score with the SNP allele.
Example (Continued)
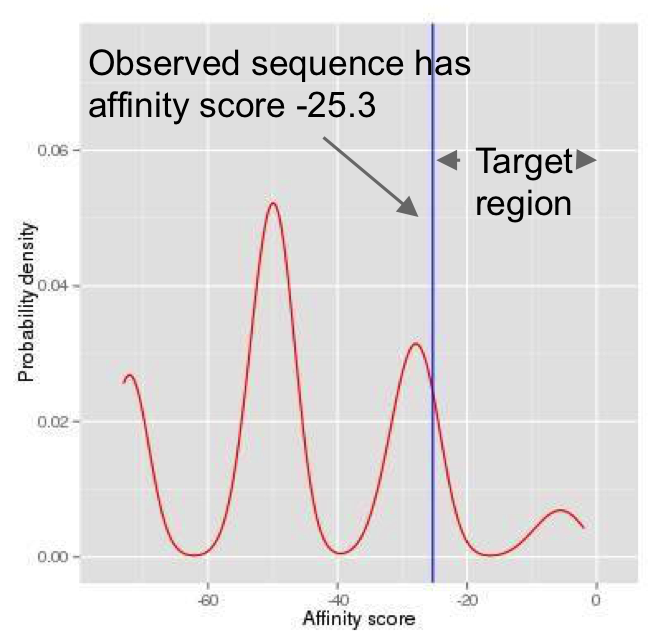
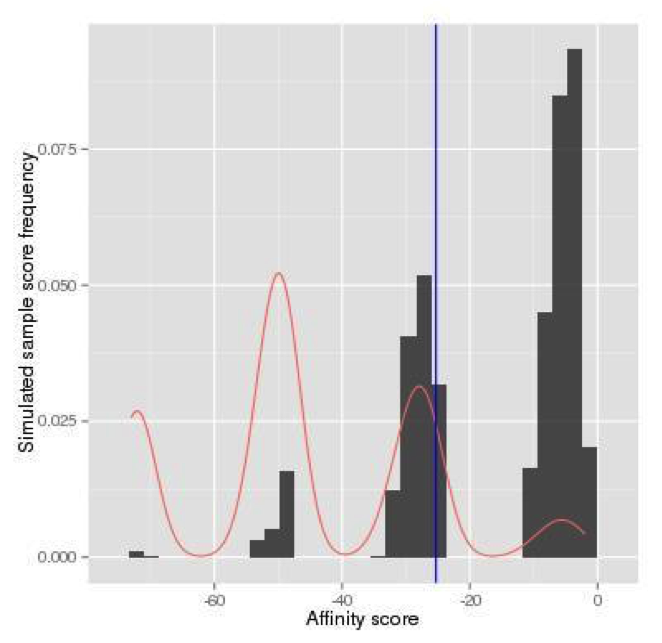
(Continued From Step 1) The log likelihood score for the reference allele is -25.30, and the log likelihood score for the SNP allele is -2.28. The p-value for the reference allele is the probability that a random sequence has an affinity score larger than or equal to -25.30, which is our target region (Figure 7). For such a small p-value, naive Monte-Carlo generates a small number of scores in the target region (Figure 8), and thus requires a large number of simulations. Alternatively, in atSNP, the importance sampling generates many more scores in the target region (Figure 9). The p-value for the reference allele is then estimated by the weighted frequency as p-value Reference = 0.499. The importance sampling algorithm significantly reduces the required number of simulations. Similarly, the p-value for the SNP allele, p-value SNP, is estimated as 0.009.
from random motif sequences.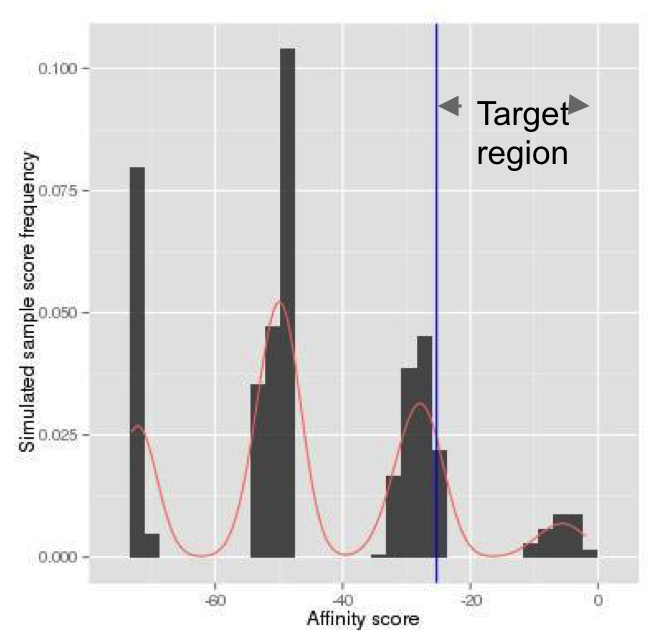
of simulated random scores with the naive
Monte Carlo method.
random scores with importance sampling.
atSNP tests the significance of log rank ratio: log(p-value Reference)-log(p-value SNP). atSNP computes the p-value (p-value SNP Impact) based on a Monte-Carlo simulation that uses both the reference and SNP alleles together. This is done using the importance sampling technique as described in Step 2.
Example (Continued)
The log rank ratio for the impact of SNP, rs117959046, is 4.02. With the importance sampling, the p-value for the log rank ratio is estimated as p-value rank = 0.005. In atSNP Search, this p-value is referred to as p-value SNP Impact.
References
atSNP search output is grouped into four general categories: SNP information, motif information, atSNP scores, and atSNP p-values. Details for these categories are summarized in the following tables:
| SNP information | |
|---|---|
| RS ID (ReferenceSNP ID number) | Identification tag assigned by NCBI to a group of SNPs that map to an identical location1 A link to the DBSNP page for any SNP shown in the data is available by clicking on the SNPid. |
| Coordinate | Formatted as chromosome:position. One of the human genome (assembly GRch38/hg38) chromosomes, e.g. Chr1-Chr22, ChrX, ChrY, ChrM. The position is the 1-based location of the SNP relative to the first base at the 5’ end of the forward strand of the reference sequence 2. A link to data around the genomic coordinate in the UCSC genome browser is available by clicking on the coordinate. |
| Reference and SNP Alleles | Formatted as Reference allele/SNP allele. e.g.: T/G. |
| Reference and SNP Strands | The reference and SNP strand information is shown on the composite logo plot. It indicates whether the displayed sequences are in the forward or reverse direction. |
- http://www.ncbi.nlm.nih.gov/books/NBK44417/#Content.what_is_a_reference_snp_or__rs_i
- https://bioconductor.org/packages/release/data/annotation/manuals/SNPlocs.Hsapiens.dbSNP144.GRCh38/man/SNPlocs.Hsapiens.dbSNP144.GRCh38.pdf
| Motif information | |
|---|---|
| Motif | Motif name, e.g., MA0002.2 For JASPAR motifs, a link to the motif's entry in JASPAR database by clicking on the motif. |
| Transcription Factor | Transcription factor name, e.g., RUNX1 When available, a link to the FACTORBOOK page for the transcription factor is provided by clicking on the transcription factor. |
| atSNP Log Likelihoods (evaluated wrt PWM) | |
|---|---|
| Rank Ratio (SNP Impact) | Log of ratio of p-value Reference to p-value SNP. This is the main statistic that the atSNP p-values are based on. |
| Reference | The log likelihood score of the best match (highest scoring subsequence) with the reference allele. |
| SNP | The log likelihood score of the best match (highest scoring subsequence) with the SNP allele. |
| Ratio | The difference between Log Likelihood Reference and Log Likelihood SNP. |
| Enhance Odds | Once atSNP identifies the best matching subsequence to the PWM with the reference allele, it evaluates the likelihood of that subsequence with the reference allele and the SNP allele. This quantity is the log of the ratio of these two likelihoods. |
| Reduce Odds | Once atSNP identifies the best matching subsequence to the PWM with the SNP allele, it evaluates the likelihood of that subsequence with the reference allele and the SNP allele. This quantity is the log of the ratio of these two likelihoods. |
| atSNP p-values | |
|---|---|
| p-value SNP Impact | A significant p-value, e.g. 0.0001, statistically supports the potential gain or loss of function of the genomic region with the SNP in terms of transcription factor binding. |
| p-value Reference | p-value for score with the reference allele (Log Likelihood Reference). A significant p-value indicates that the match to the PWM with the reference allele is statistically supported. |
| p-value SNP | p-value for scores with the SNP allele (Log Likelihood SNP). A significant p-value indicates that the match to the PWM with the SNP allele is statistically supported. |
| *p-value Difference | p-value for the difference in scores with the reference and the SNP alleles (Log Likelihood Ratio). This is essentially the result from a likelihood ratio test. While we report this for completeness, the final atSNP results are based on p-value SNP impact which quantifies the significace of the Log Rank Ratio. |
| *p-value Condition Ref | Conditional p-value for scores on the reference allele based on Log Enhance Odds. |
| *p-value Condition SNP | Conditional p-value for scores on the SNP allele based on Log Reduce Odds. |
Example
We evaluate the impact of the SNP rs117959046 on the binding of the transcription factor GATA2, using the GATA_known12 motif:
|
|
|
|
||||||||||||||
| atSNP Results | ||
|---|---|---|
| Log Likelihood | p-value | |
| SNP Impact (Rank Ratio) | 4.02 | 0.00484 |
| Reference | -25.3 | 0.499 |
| SNP | -2.27 | 0.00898 |
| Ratio | -23.0 | 0.0207 |
| Enhance Odds | 23.0 | 0.499 |
| Reduce Odds | -23.0 | 0.00184 |
The SNP “rs117959046” is a genetic mutation from C to T in the forward strand at location Chromosome 1: 134,339,671. This creates a highly likely binding site for the transcription factor GATA2 as supported by the p-value SNP Impact of 0.00484. Furthermore, the p-value for the best match between the GATA2 motif and the DNA sequence with the SNP allele is 0.00898, whereas the p-value for the best match between the motif and the DNA sequence with the reference allele is 0.499. These p-values indicate that this genomic location, spanning the SNP position, does not harbor a GATA2 binding site with the reference allele, but the SNP creates a likely GATA2 binding site. Overall, atSNP statistically supports that the SNP leads to generation of an in silico predicted GATA2 binding site.
atSNP provides a composite logo plot to visualize the impacts of SNPs on transcription factor binding. These plots reveal whether the SNP might lead to gain of function or loss of function.
Examples
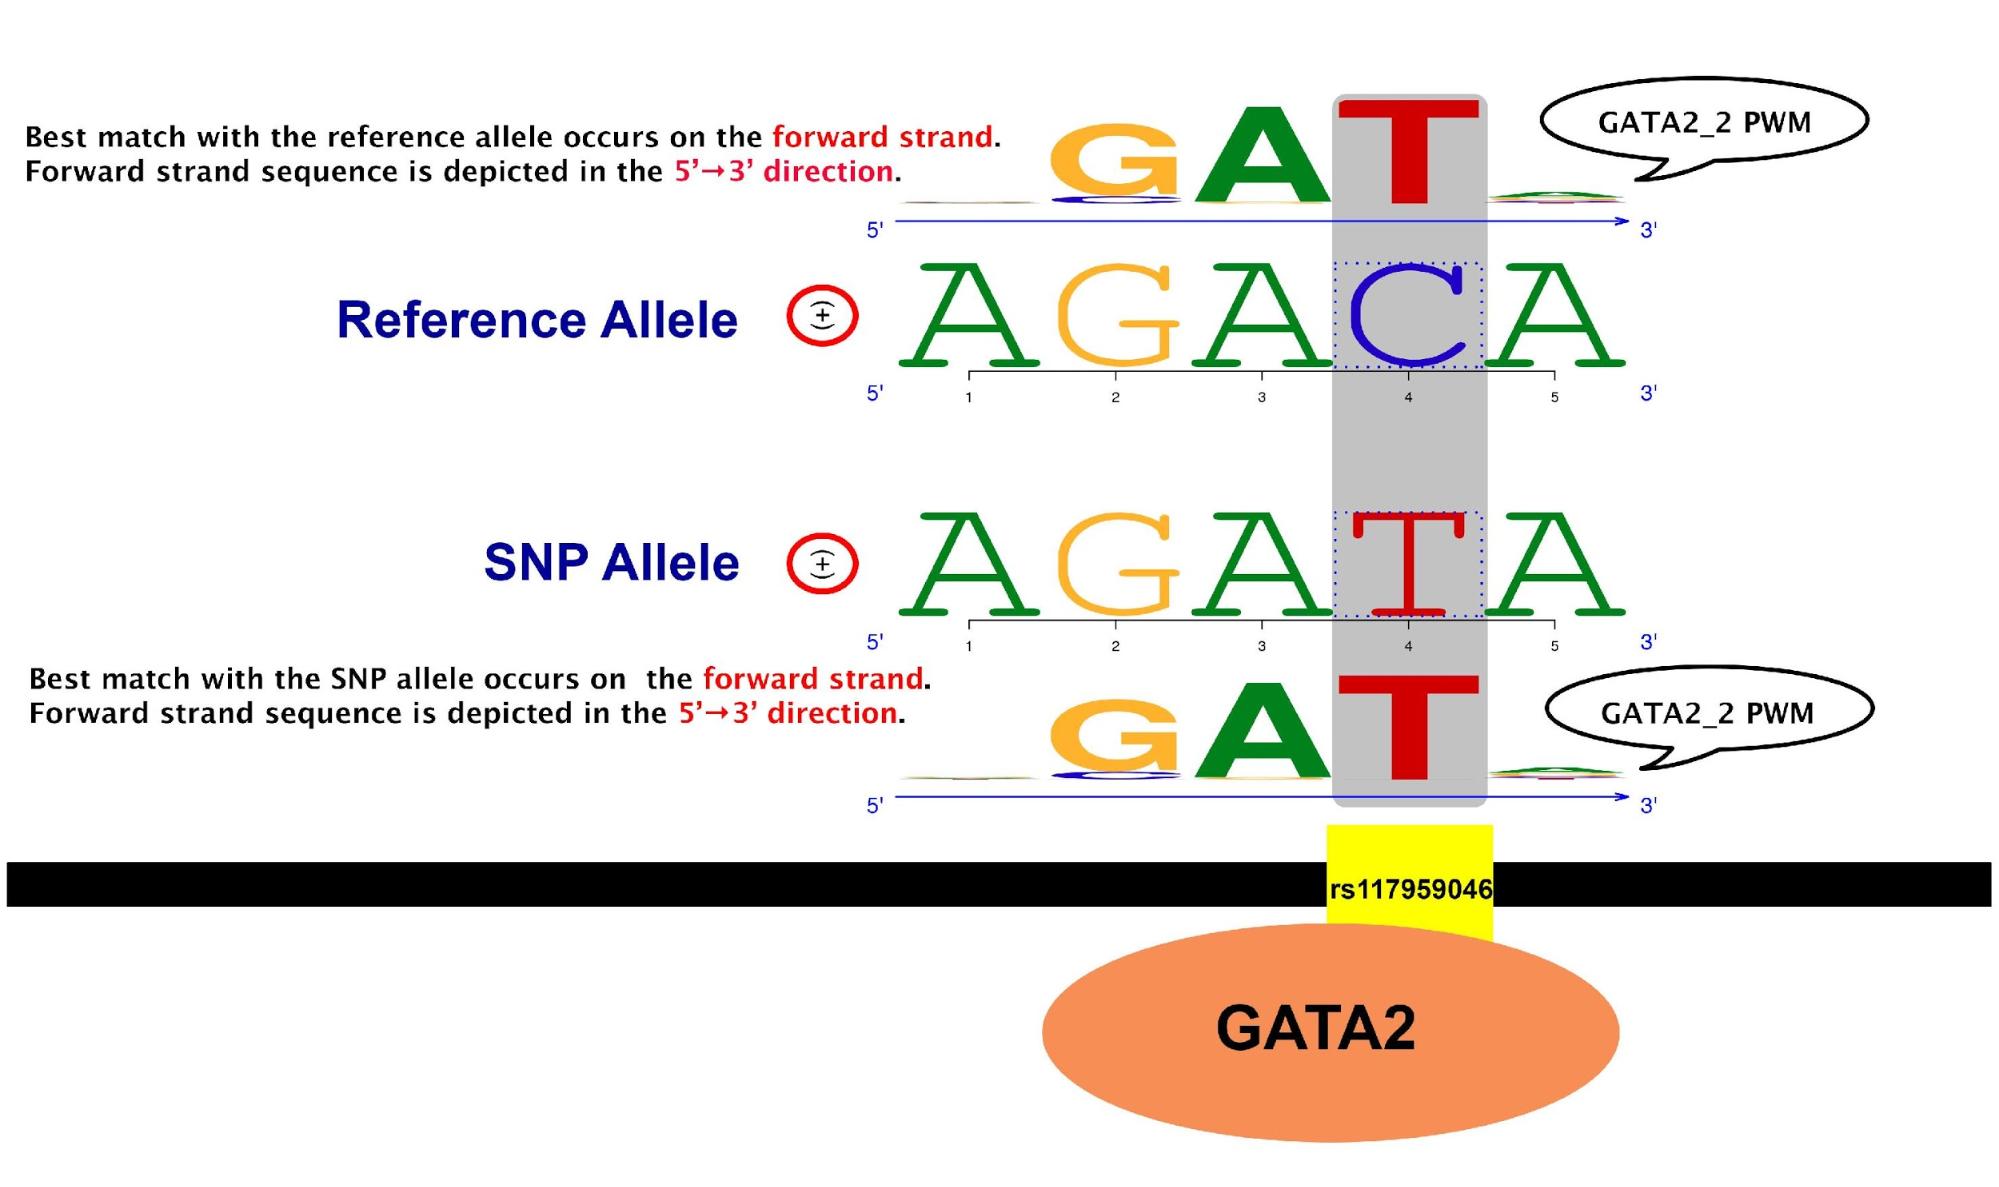
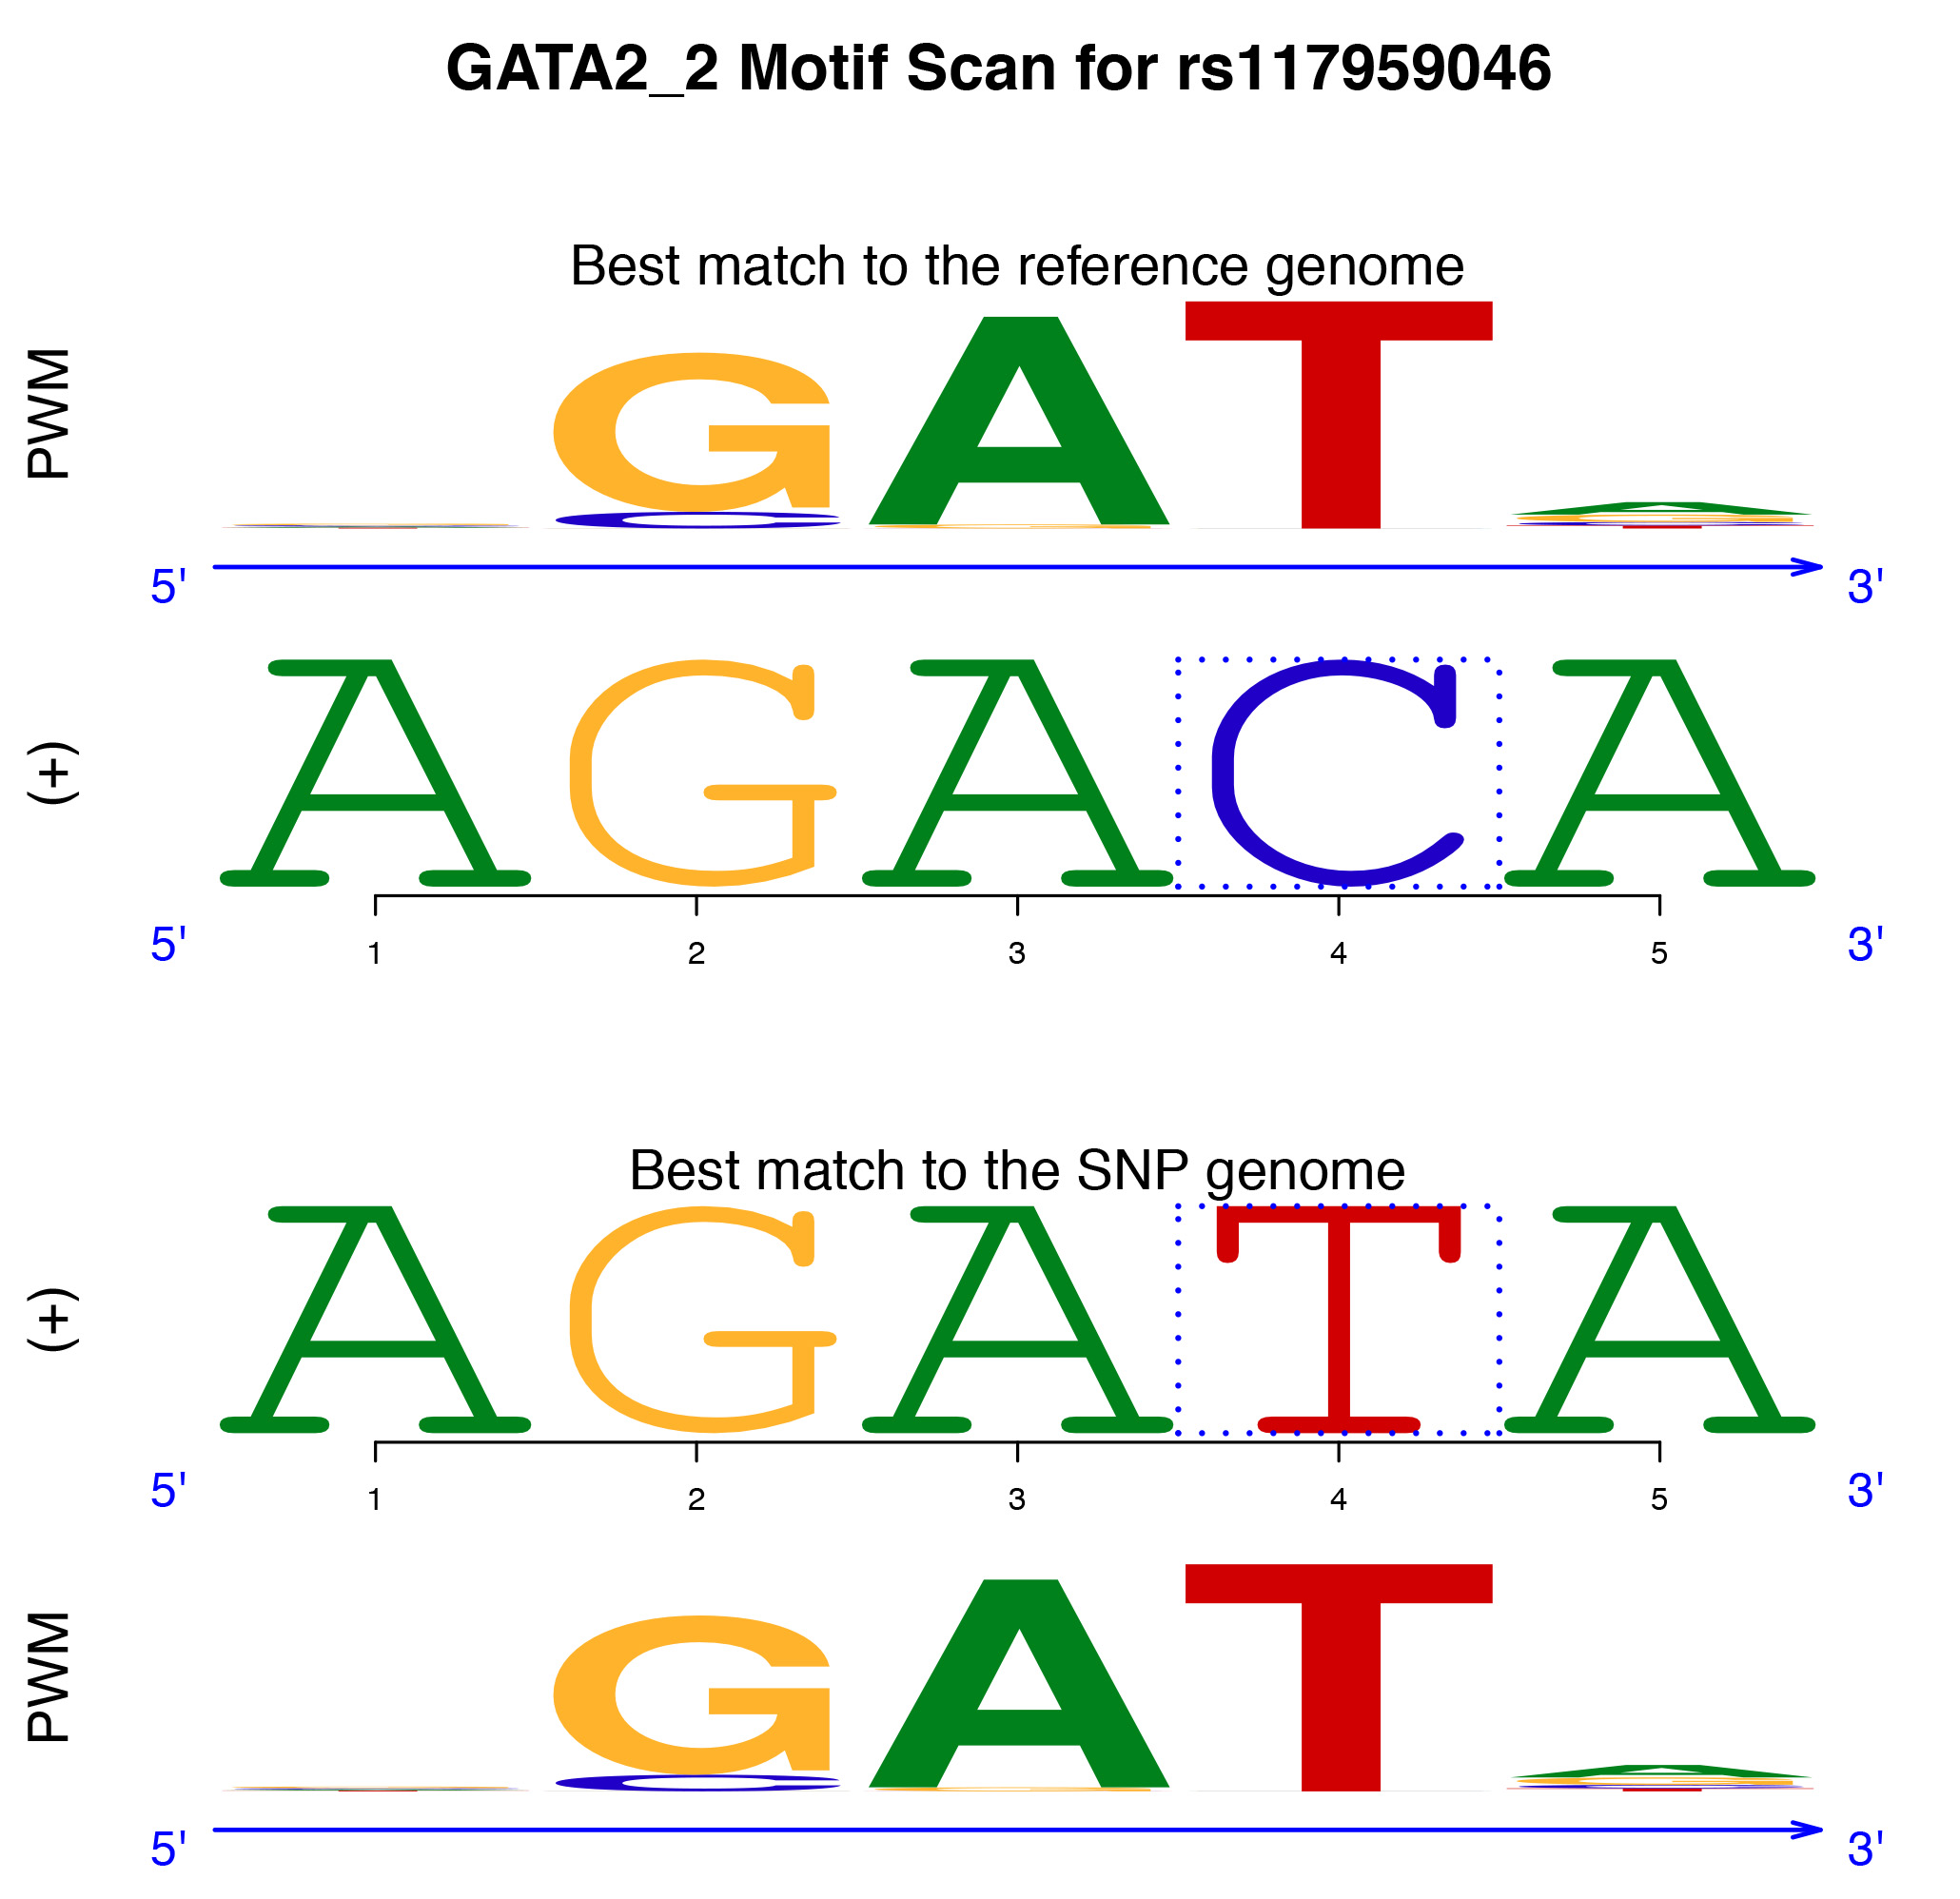
The SNP, rs117959046, is highly likely to create a binding site for the transcription factor GATA2 on the genome. The composite logo plot illustrates this with the comparison between the best matches of GATA2_2 PWM to the DNA sequence overlapping the SNP position with the reference and SNP alleles. Among subsequences of length 5 overlapping the SNP position with the reference allele, “AGACA” on the forward strand has the largest log likelihood score. This subsequence is referred to as the “best match with the reference allele”. This subsequence is depicted on the second row with the corresponding PWM on the first row. Similarly, among subsequences of length 5 overlapping the SNP position with the SNP allele, “AGATA” on the forward strand is referred to as the “best match with the SNP allele”. It is depicted on the third row with the corresponding PWM on the fourth row.
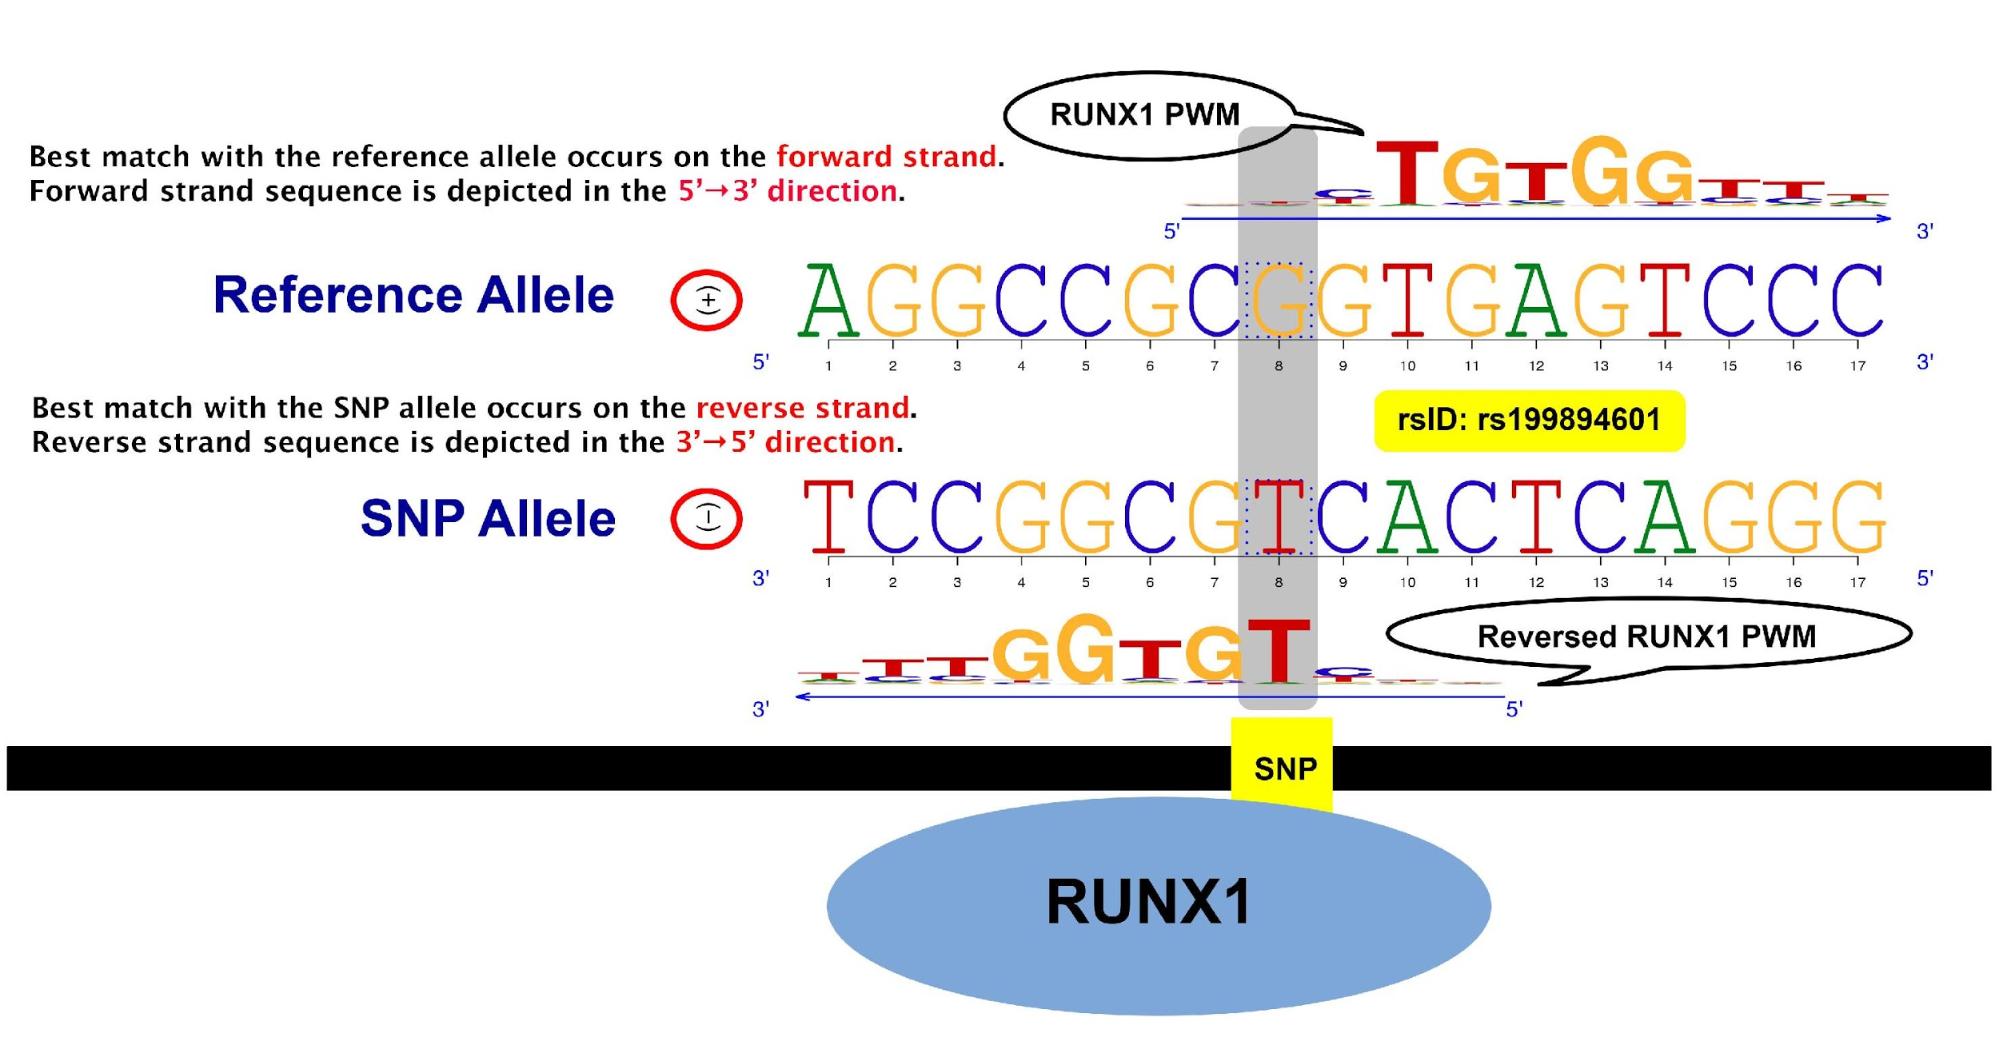
The SNP, rs199894601, is highly likely to create a binding site for the transcription factor RUNX1 on the genome. The best match position on the genome with the SNP allele is different from that with the reference allele. Specifically, the best matches occur on different strands and genomic coordinates (bp). The composite logo plot illustrates this with the comparison between the best matches of RUNX1 PWM from JASPAR to the DNA sequence overlapping the SNP location with the reference and SNP alleles. The beginning of the best match with the SNP allele is 3 bases before the SNP position in the 5' to 3' direction on the reverse strand. Among subsequences of length 11 overlapping the SNP position with the SNP allele, this subsequence has the largest log likelihood score. This subsequence is referred to as the “best match with the SNP allele” and is depicted on the third row with the corresponding PWM on the fourth row. Similarly, the “best match with the reference allele” is depicted on the second row with the corresponding PWM on the first row. The beginning of the best match with the reference allele is one base before the SNP position in the 5' to 3' direction on the forward strand.
We report response time for the five search types under various combinations of query parameters and significance levels. We performed two experimental runs under one combination of each search type at a time and recorded both response times. Overall, both query type and size of query results determine the response time.
| SNPid List | p-value | |
|---|---|---|
| # of SNP IDs | 0.05 | 0.01 |
| 15 | 13.7-19.6 sec | 14.7-32.1 sec |
| 50 | 9.2-40.1 sec | 3.5-27.0 sec |
| 100 | 29.7-32.5 sec | 13.6-14.4 sec |
| 500 | API timed out | API timed out |
| SNPid Window | p-value | |
|---|---|---|
| Window Size | 0.05 | 0.01 |
| 100 | 2.7-9.6 sec | 2.7-3.3 sec |
| 1K | 2.8-22.0 sec | 3.3-5.2 se |
| 10K | 40.5-53.4 sec | 12.3-24.1 sec |
| 100K | API timed out | API timed out |
| Genomic Location | p-value | |
|---|---|---|
| Window Size | 0.05 | 0.01 |
| 1K | 3.9-12.5 sec | 3.1-5.2 sec |
| 10K | 22.8-51.1 sec | 7.9-32.3 sec |
| 50K | 39.4-55.9 sec | 36.1-37.4 sec |
| 100K | API timed out | API timed out |
| Gene | p-value | |
|---|---|---|
| Window Size | 0.05 | 0.01 |
| 100 | 4.9-11.5 sec | 2.2-2.7 sec |
| 1K | 9.5-29.3 sec | 2.6-7.3 sec |
| 5K | 46.7-61.2 sec | 24.5-33.2 sec |
| 10K | API timed out | API timed out |
| Transcription Factor | p-value | ||
|---|---|---|---|
| 0.05 | 0.0005 | ||
| JASPAR | ZNF263 | 2.3-4.7 sec | 2.5-2.6 sec |
| CTCF | 3.8-5.1 sec | 2.6-3.9 sec | |
| ENCODE | AFP | 2.7-3.3 sec | 1.7-5.4 sec |
| GATA | 40.3-47.7 sec | 27.9-43.6 sec | |
Swapping P-Value Cutoff Operators
The operator for the SNP and reference p-value cutoffs can be swapped between ≤ and >. To reverse the operator for one of these cutoffs, click on the button with the operator on it beside the corresponding p-value.
Adjusting the Sort Order
The sort control indicates the priority of sort fields and the
direction of each sort field. If a field has top sort priority, then
that field will be the one that results are sorted by. Any results
which have the same value for the first sort field will be ordered
by the values of the fields with the second sort priority and so on.
To reverse the sort order for one sort field from ascending to
descending or vice-versa, click the icon by that search field.
To advance or demote a sort field's priority, select it (by
clicking on it) and click the up or down arrow.
Filtering by Motif Degeneracy
This control is based on computing information content (IC) of each individual position within a PWM, then taking the median of the information content across all positions. These median IC values are then percentiled (25%, 50%, and 75%) to classify each PWM into the following four classes.
| Median Information Content | Motif Degeneracy Label |
|---|---|
| [0, 0.70) | Very High |
| [0.7, 1.1) | High |
| [1.1, 1.52) | Moderate |
| [1.52, 2] | Low |
Low information content indicates a very degenerate motif. While this does not have implications in terms of actual functionality, when possible, following up less degenerate motifs is more preferable.
Limitations on Numeric Queries
Queries are numerically limited in the following ways:
SNPid
Up to 1,000 SNPids may be entered. Plain text files or direct input are both acceptable.SNPid Window
The window size is limited to 125 million bases.Genomic Location
The maximum region size is 250 million bases. The region size is calculated by subtracting the start location from the end location on the selected chromosome.Gene
The region around the gene is limited to 125 million bases.
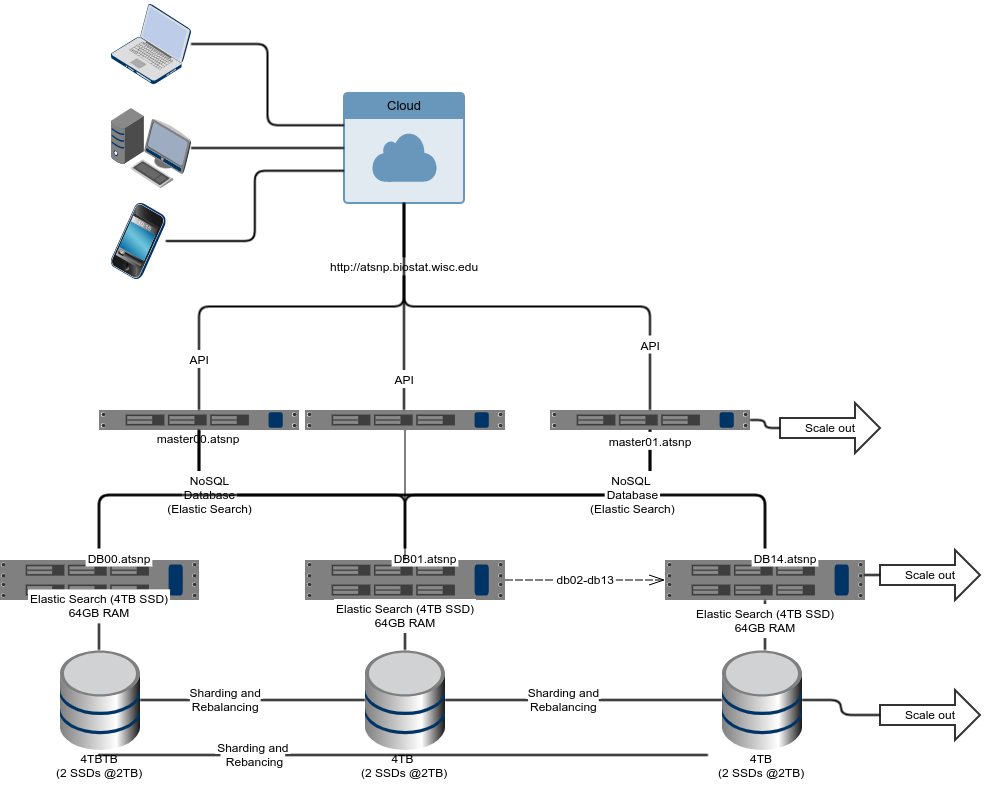
atSNP Search utilizes a scale-out systems architecture to store and retrieve approximately thirty seven billion records. Elasticsearch, a NoSQL database, utilizes a distributed scale-out system design for large w orkloads. It accomplishes this task by distributing requests for searches amongst the scaled computing resources. A n API handles communication between the search page and the Elasticsearch data store.
-
- Zuo, Chandler, Shin, Sunyoung, and Keleş, Sündüz. atSNP: transcription factor binding affinity testing for regulatory SNP detection. Bioinformatics (2015): 31, 3353-3355.
- Shin, Sunyoung, Hudson, Rebecca, Harrison, Christopher, Craven, Mark, and Keleş, Sündüz. atSNP Search: a web resource for quantifying impact of dbSNP SNPs on transcription factor binding. (2018). In preparation.